Data Analytics
Decisions taken on this week's numbers instead of last quarter's report.
Situations you will recognise.
By the time the pack is circulated, the month it describes is already gone.
Totals are visible, but which product, branch or client is actually profitable is a guess.
You are overstocked on slow lines and out of the ones customers ask for.
Customers leave quietly, and the pattern that predicted it was in the data all along.
Data is abundant but insight is scarce. Most organisations collect reports no one reads, while the real signals remain buried in operational noise.
We audit your data sources, define KPIs, and spot the gaps that kill reliable reporting.
Dimensional models, data warehouses, and self-service BI layers.
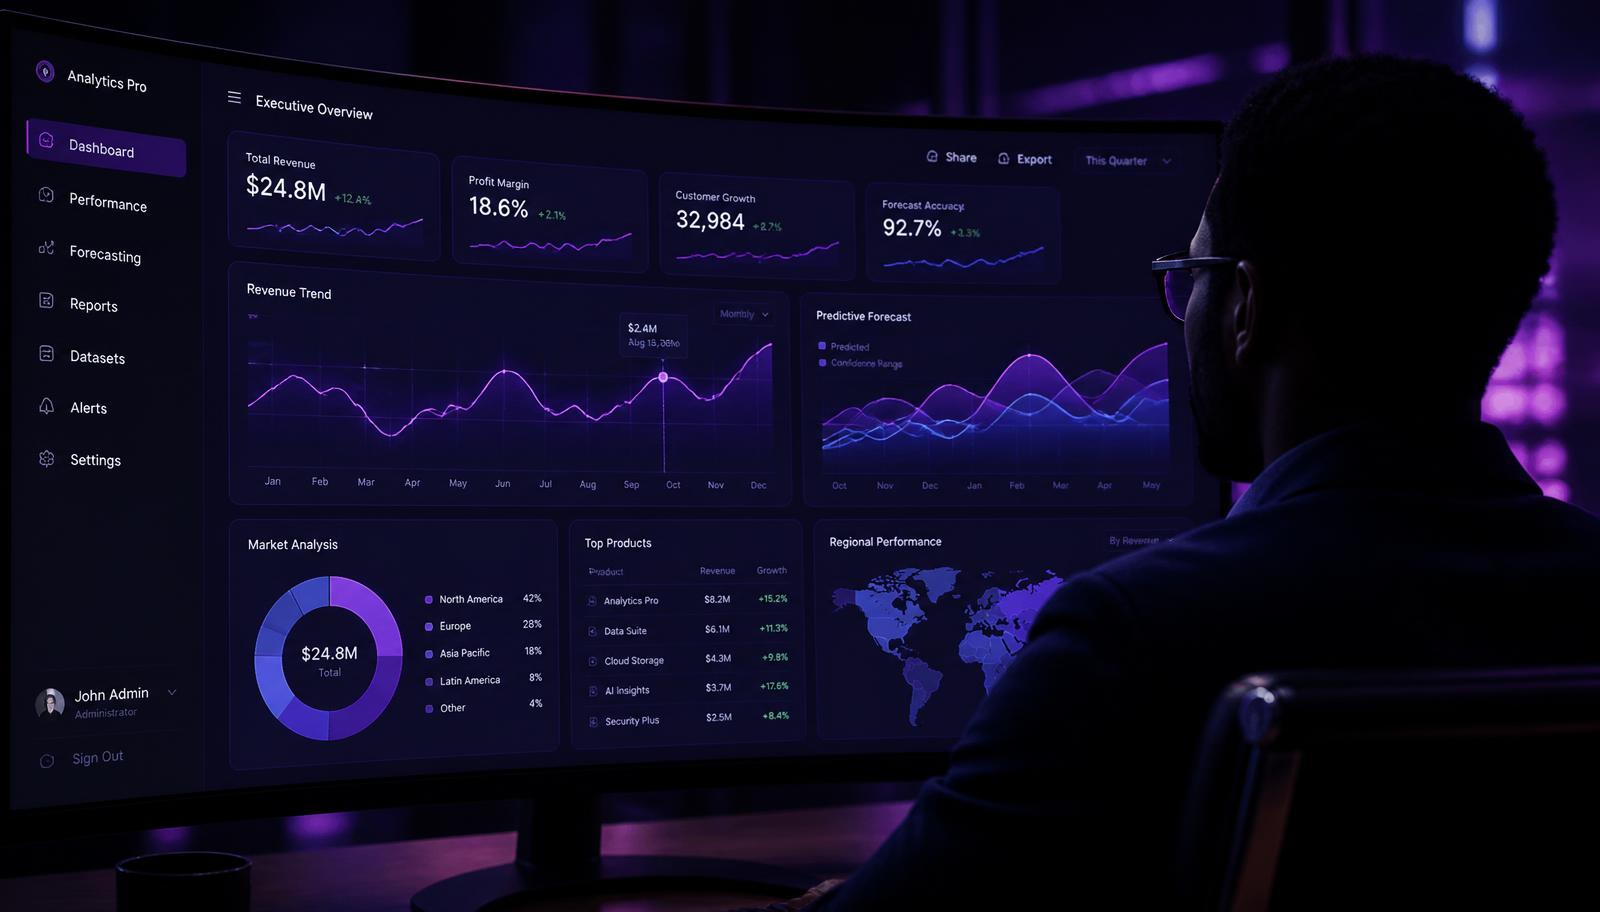
Executive dashboards, operational alerts, and automated reporting pipelines.
Training and workflows that turn dashboards into decisions.
- Analytics strategy & KPI map
- Data warehouse or lakehouse
- Executive dashboards
- Automated reporting layer
- Analytics training programme
Clients report 2 to 5x faster decision cycles after go-live
Data Analytics: common questions
- What does Kwish's Data Analytics service deliver?
- Decisions taken on this week's numbers instead of last quarter's report.
- What problems does Data Analytics solve?
- It is built for situations like these: the monthly report arrives too late to act on; you know the revenue, not the margin; stock is wrong in both directions; churn is only noticed after it happens. Data is abundant but insight is scarce. Most organisations collect reports no one reads, while the real signals remain buried in operational noise.
- What do we receive at the end of the engagement?
- Analytics strategy & KPI map, Data warehouse or lakehouse, Executive dashboards, Automated reporting layer, Analytics training programme. Your team owns the system after handover, with documentation, training sessions and 90 days of support.
- How does Data Analytics affect revenue and cost?
- On the revenue side: Line-level profitability normally reveals products or clients being served below cost and others that can carry a price rise. On the cost side: Forecast-driven ordering targets a 15 to 30 percent reduction in the capital tied up in slow-moving inventory. Any percentage ranges we quote are targets we work towards and measure with you, not guarantees.
- How does Kwish run a Data Analytics project?
- Five stages: discovery (one week inside your workflow. we map the process, the data and the people who touch it.); scoped quotation (a fixed scope, milestones and a price. no open-ended retainers to start.); build (we build in two-week increments against your real data, with you reviewing each one.); go live (integration with the systems already in use, load testing, and a phased switch-on.); team training (your staff run the system. documentation, sessions and 90 days of support after handover.).
- Which countries does Kwish work in?
- Kwish Technologies operates from offices in Uganda, Kenya, Sweden and Canada, and delivers across Africa remotely and on site.
Keep exploring
Where Data Analytics fits across Kwish
The sectors we deliver this in, the research behind our approach, and case studies where we have shipped it.
Sectors where this applies
Research and analysis
Two sides of the same investment.
The ranges below are targets Kwish works towards on this kind of engagement, based on our own deployments. They are targets, not guarantees, and we agree the measurement method with you before we build.
How this expands revenue
Line-level profitability normally reveals products or clients being served below cost and others that can carry a price rise.
Churn signals let you intervene while the customer is still yours, which costs far less than winning a replacement.
Better forecasts mean you can promise delivery dates you will meet, which wins repeat business.
How this cuts cost
Forecast-driven ordering targets a 15 to 30 percent reduction in the capital tied up in slow-moving inventory.
Automated dashboards replace the recurring manual assembly of the same figures every month.
Attribution shows which marketing, routes or branches produce nothing, which is usually the fastest saving to act on.
Discovery to live system to a team that can run it.
One week inside your workflow. We map the process, the data and the people who touch it.
A fixed scope, milestones and a price. No open-ended retainers to start.
We build in two-week increments against your real data, with you reviewing each one.
Integration with the systems already in use, load testing, and a phased switch-on.
Your staff run the system. Documentation, sessions and 90 days of support after handover.
Work you can inspect.
Ready to see what this saves you?
Send us the workflow you want fixed. We reply with a scoped quotation, not a brochure.
Most quotations answered within one business day.